Method first · numbers second · limits always visible
The record, with its boundaries
Every number here is measured on a phone, bounded, and traceable to a raw CSV or a named file in the source repository. Where two measurements disagree, both are published with their dates.
Method
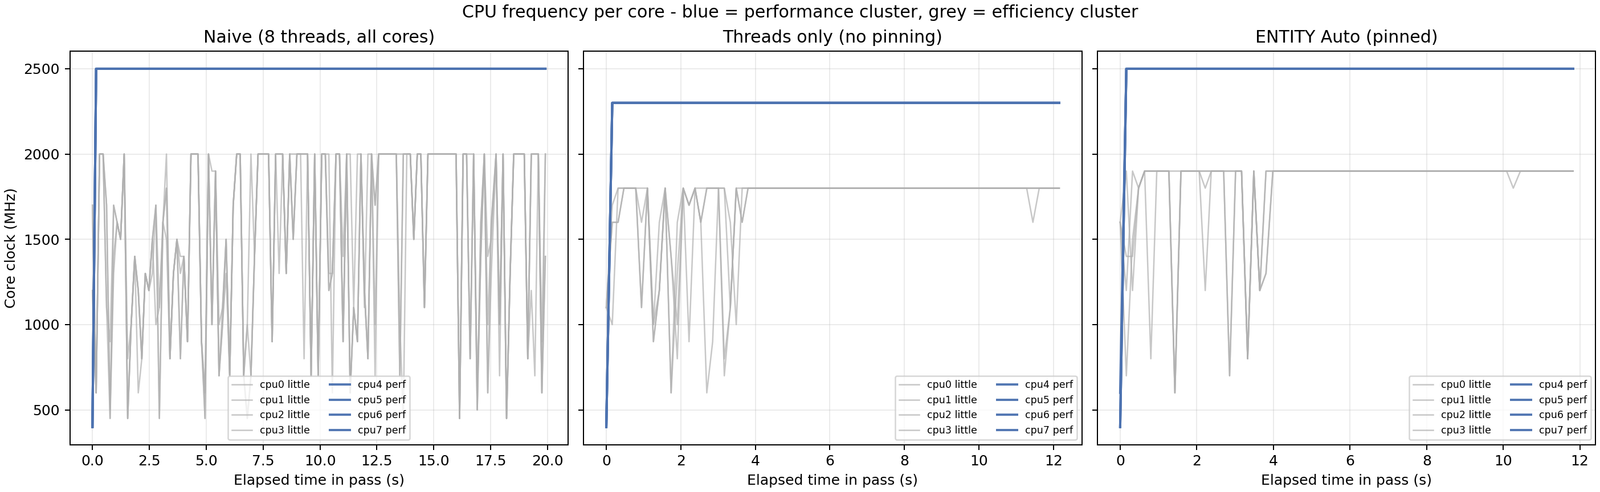
Synthetic llama-bench workload: PP 512 / TG 128, on an unplugged phone, one discarded PP 64 / TG 16 warm-up, then the arms in fixed order: naive, threads-only, Auto (plus the optional efficiency arm).
Thermal control before every pass, in every arm - so the ordering cannot favour the last arm: at least 15 s, up to 90 s, until battery temperature returns within 0.5 C of the pre-benchmark reading (without waiting below 37.5 C).
Values are the median across runs, ± population standard deviation. Every pass exports to CSV: per-pass metrics, 150 ms telemetry samples, per-core clock traces, and the per-arm affinity policy.
The mask the kernel actually applied is logged per arm,
so a failed sched_setaffinity cannot masquerade as "pinning earns
nothing":
adb logcat -s ai-chat | grep "effective cpus"

pinned inference to 8 fast cores, effective cpus [0..7]   <- naive
affinity off, 4 threads placed by the scheduler           <- threads-only
pinned inference to 4 fast cores, effective cpus [4,5,6,7]<- Auto
If threads-only and Auto print the same mask, the ablation did not happen and its attribution must not be published (benchmarks/REPRODUCIBILITY.md).
What the naive arm is - and why it is not a strawman.
It runs 8 threads across all 8 cores because that is the number upstream llama.cpp picks
for itself on this phone. common_cpu_get_num_math() counts only the
performance cores on hybrid CPUs, but that path is compiled out on Android - the guard
reads !defined(__ANDROID__) - so the function falls through to
common_cpu_get_num_physical_cores() and returns 8 on a 4+4 chip.
Every multiplier on this site is therefore measured against what an integrator gets by
building llama.cpp and not passing -t. That is a default, not a
configuration chosen to lose - and it loses on this hardware for a nameable reason: four
of those eight threads land on Cortex-A55s at roughly a third of an A78's throughput, and
every decode step waits on the slowest of them.
The honest cost of that choice is that the naive arm is also the noisiest, because a straggler thread's timing varies with whatever else the scheduler is doing. It is why the July summary is "roughly 2x from the thread count" rather than one fixed percentage, and why the naive column carries the widest error bars in every table below.
100 tok 16.4 t/s TTFT 299 ms 33.0°C 4.34 W CPU 47% 1.2 GB live stats bar - ENTITY v3.6.2
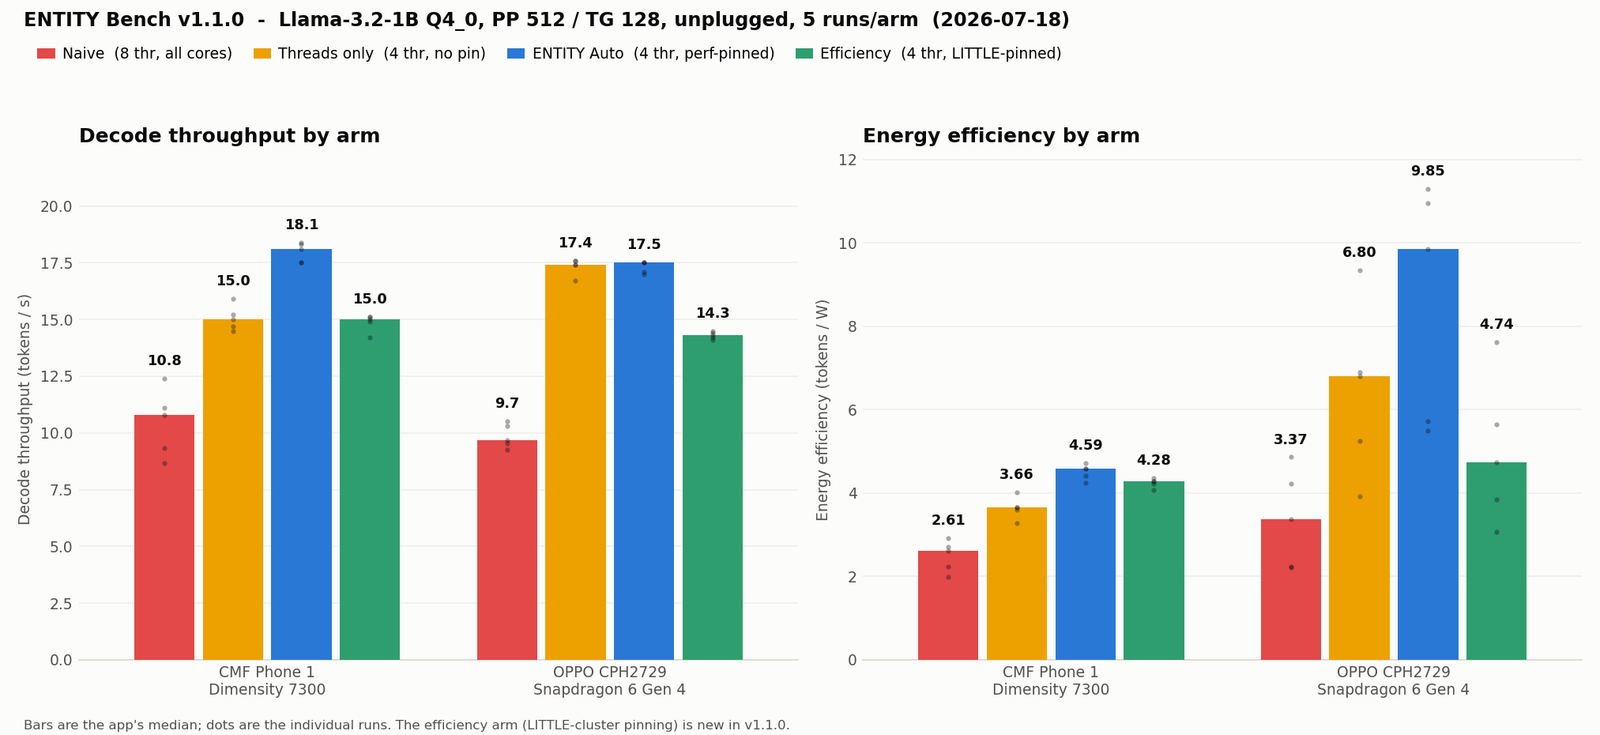
The benchmark of record: four arms, five runs per arm
ENTITY Bench v1.1.0 exports, 2026-07-18, Llama-3.2-1B Q4_0, unplugged, raw CSVs retained
in benchmarks/results/.
CMF Phone 1 (Nothing A015), Dimensity 7300 · start 31 C
| Arm | Decode tok/s | Prompt tok/s | TTFT ms | Power W | tok/W |
|---|---|---|---|---|---|
| Naive (8 thr, all cores) | 10.8 ± 1.3 | 111 ± 13.6 | 4,720 | 4.25 ± 0.12 | 2.61 ± 0.33 |
| Threads only (4 thr, no pin) | 15.0 ± 0.5 | 137 ± 1.4 | 3,803 | 4.09 ± 0.17 | 3.66 ± 0.24 |
| ENTITY Auto (4 thr, pinned) | 18.1 ± 0.4 | 139 ± 0.8 | 3,739 | 3.96 ± 0.07 | 4.59 ± 0.17 |
| Efficiency (4 thr, LITTLE) | 15.0 ± 0.3 | 82.5 ± 0.2 | 6,272 | 3.51 ± 0.02 | 4.28 ± 0.09 |
Thread count earns +39% decode; pinning earns +21%.
OPPO CPH2729, Snapdragon 6 Gen 4 · start 35.3 C
| Arm | Decode tok/s | Prompt tok/s | TTFT ms | Power W | tok/W |
|---|---|---|---|---|---|
| Naive (8 thr, all cores) | 9.7 ± 0.5 | 152 ± 4.5 | 3,473 | 2.87 ± 1.04 | 3.37 ± 1.05 |
| Threads only (4 thr, no pin) | 17.4 ± 0.3 | 129 ± 22.4 | 4,026 | 2.52 ± 0.90 | 6.80 ± 1.82 |
| ENTITY Auto (4 thr, pinned) | 17.5 ± 0.2 | 129 ± 23.1 | 4,026 | 1.78 ± 0.71 | 9.85 ± 2.54 |
| Efficiency (4 thr, LITTLE) | 14.3 ± 0.1 | 127 ± 1.9 | 4,101 | 3.06 ± 0.96 | 4.74 ± 1.57 |
Thread count earns +80% decode; pinning earns +1%.
python3 benchmarks/plot_four_arm.py The July three-run record (history, retained)
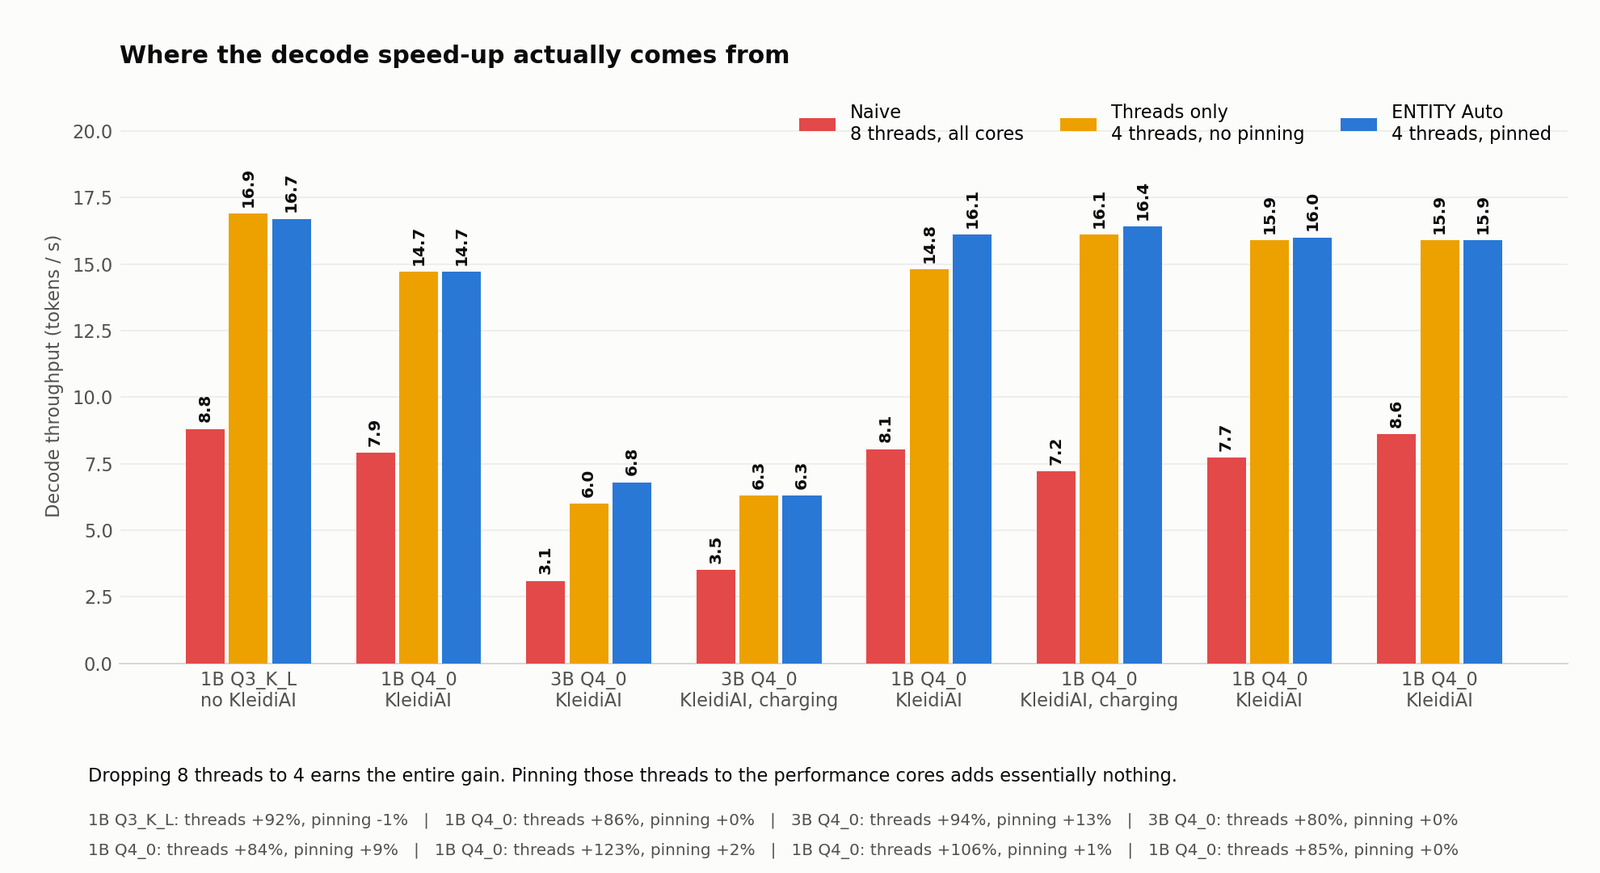
| Model / runs | Naive 8 thr | Threads only | Auto | Thread count | Pinning |
|---|---|---|---|---|---|
| 1B Q3_K_L, 3 runs | 8.8 ± 0.50 | 16.9 ± 0.08 | 16.7 ± 1.3 | +92% | -1% |
| 1B Q4_0, 1 run | 7.9 | 14.7 | 14.7 | +86% | +0% |
| 1B Q4_0, 3 runs (midday) | 7.7 ± 0.78 | 15.9 ± 0.22 | 16.0 ± 2.1 | +106% | +1% |
| 1B Q4_0, 3 runs (evening) | 8.6 ± 0.82 | 15.9 ± 1.58 | 15.9 ± 0.09 | +85% | +0% |
| 3B Q4_0, 1 run | 3.1 | 6.0 | 6.8 | +94% | +13% |
| 3B Q4_0, 1 run | 3.5 | 6.3 | 6.3 | +81% | +0% |
The two 3B runs disagree, a third taken while charging measured -16%, and single 3B runs swing about ±15% - the +13% is noise, not a finding. The honest summary across every three-run set is "roughly 2x from the thread count", not one fixed percentage, because the naive baseline is the noisiest arm.
python3 benchmarks/plot_results.py 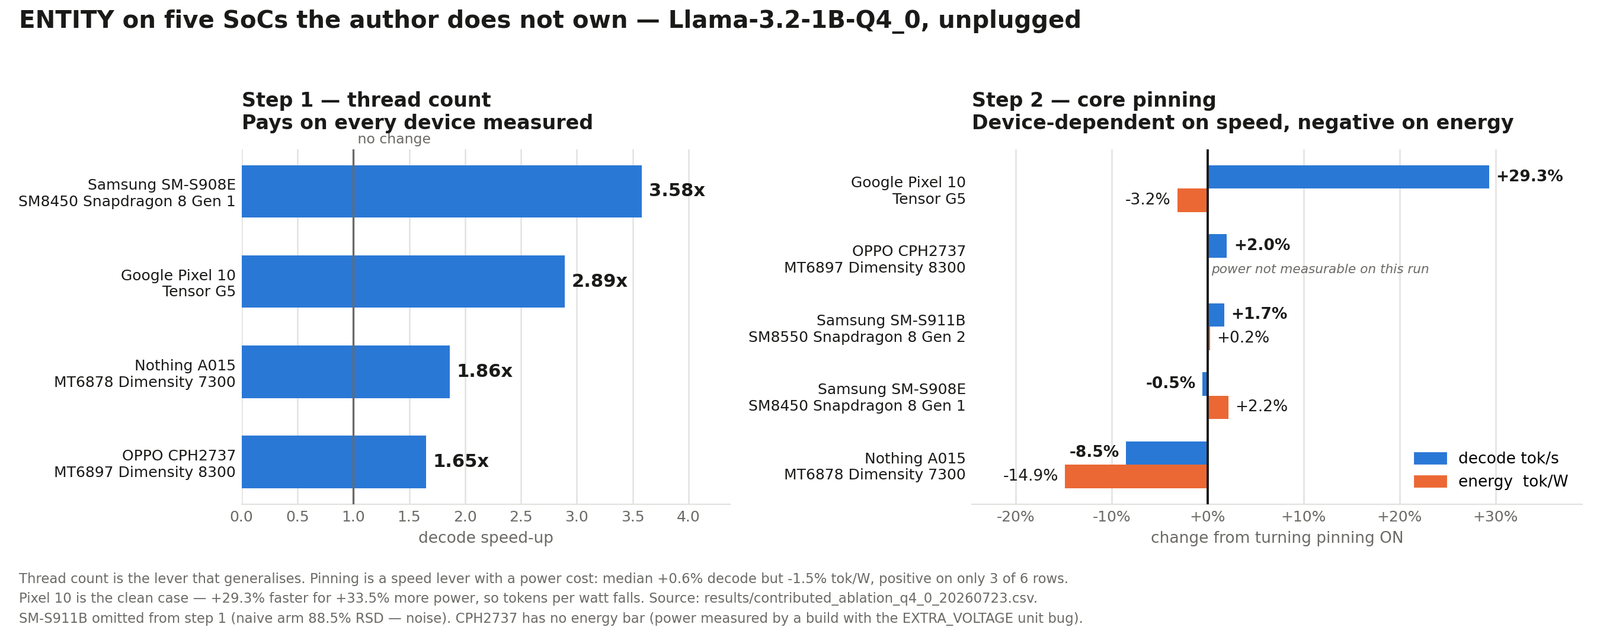
python3 benchmarks/plot_contributed.py 100 tok 16.4 t/s TTFT 299 ms 33.0°C 4.34 W CPU 47% 1.2 GB live stats bar - ENTITY v3.6.2
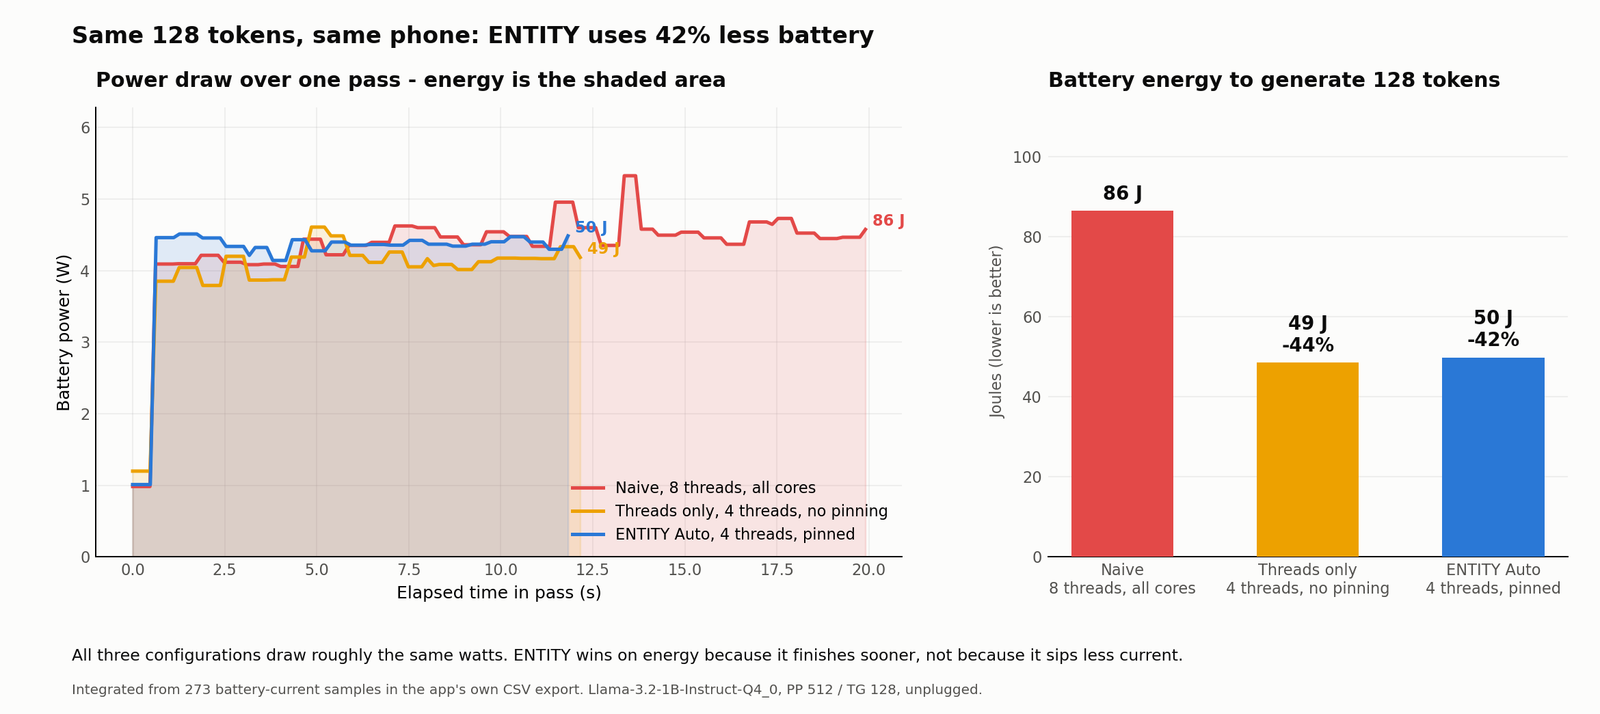
Energy: the same work, 42-47% less battery
The CSV export records battery current every 150 ms, so the energy a pass cost is integrated from the measured power curve (trapezoid over 273 samples), not inferred. From the 2026-07-15 evening export, first pass of each arm:
| Arm | Duration | Mean power | Energy, 128 tok |
|---|---|---|---|
| Naive (8 threads) | 19.9 s | 4.34 W | 86 J |
| Threads only | 12.2 s | 3.98 W | 49 J (-44%) |
| ENTITY Auto | 11.8 s | 4.22 W | 50 J (-42%) |
All three configurations draw roughly the same watts. ENTITY does not win by sipping less current - it wins because it finishes in 11.8 s instead of 19.9 s. The earlier 2026-07-14 single-run export measured the same shape: 95 / 57 / 51 J. Threads-only vs Auto is inside the noise on this metric.
python3 benchmarks/plot_energy.py benchmarks/results/entity_1b-q4_0_unplugged_3run_20260715b.csv 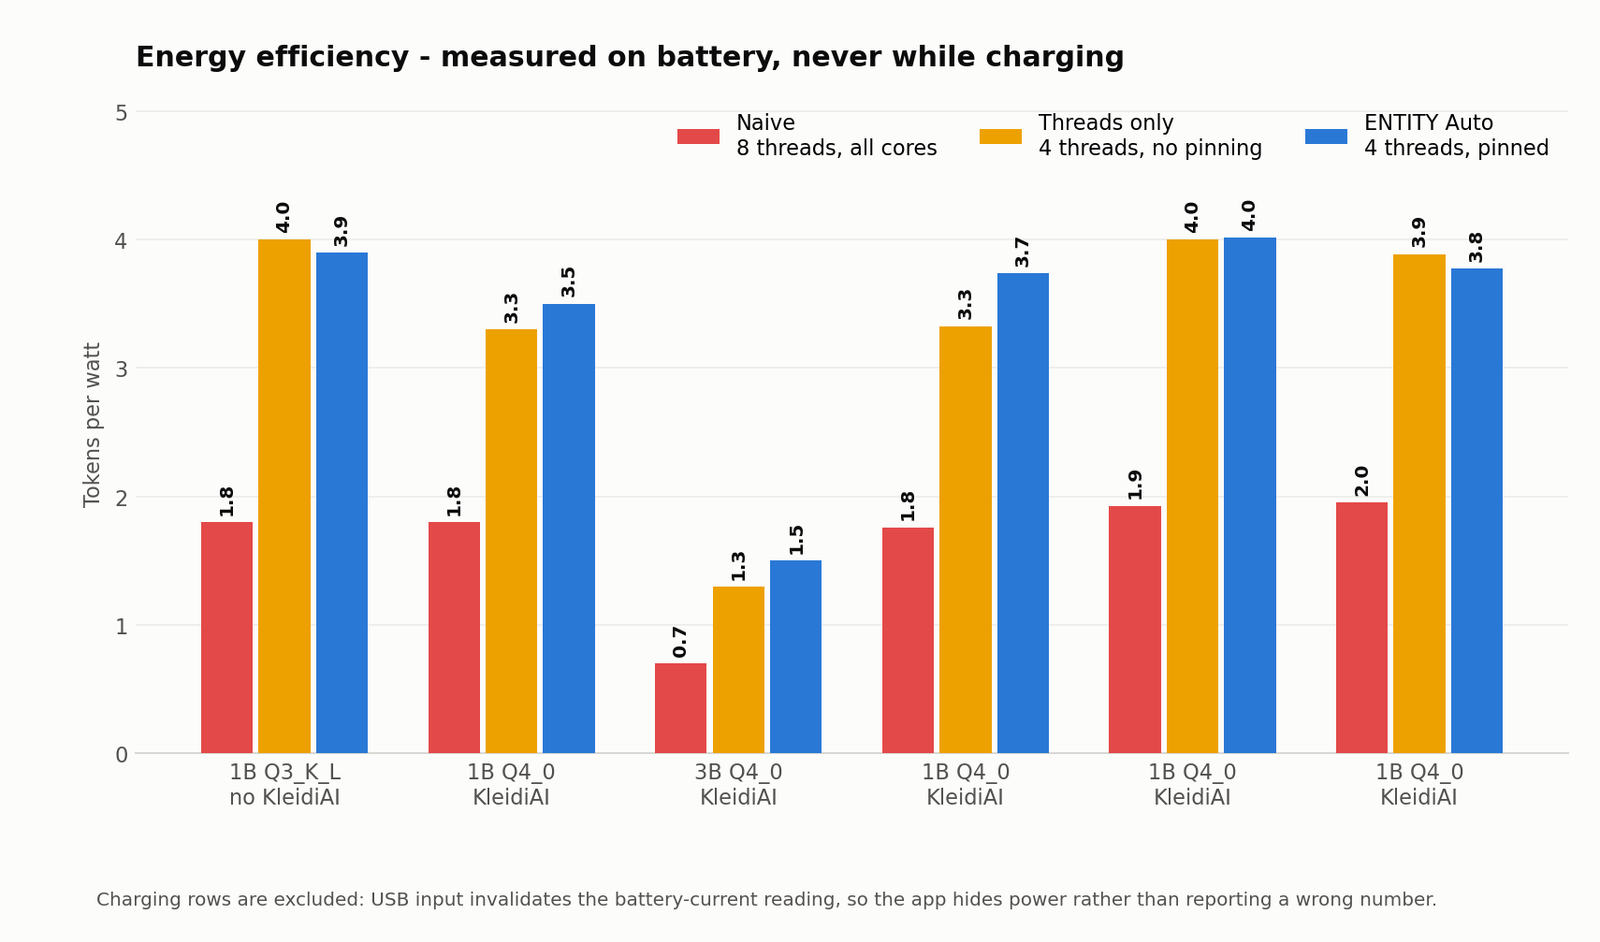
python3 benchmarks/plot_results.py The speedup does not change the answer
Every speed number on this site comes from changing how work is scheduled - how many threads decode uses, which cores they run on. Nothing touches the weights or the sampler, so the obvious assumption is that only the wait gets shorter.
That assumption is not free. ggml splits a row's dot product across threads and sums the partials, so the thread count fixes the order of a floating-point reduction - and floating-point addition is not associative. Different order, different last bits; different last bits in a logit, and a near-tie token flips. This project already depends on the effect being real: the perplexity sweep pins its thread count for exactly this reason. It had never been measured.
| Arm | Threads | CPUs | 96 greedy tokens | Per-chunk PPL |
|---|---|---|---|---|
| Naive | 8 | 0-7 | byte-identical | identical 12/12 |
| Threads only | 4 | 0-7 | byte-identical | identical 12/12 |
| ENTITY Auto | 4 | 4-7 | reference | reference |
| Efficiency | 4 | 0-3 | byte-identical | identical 12/12 |
Dimensity 7300, Llama-3.2-1B Q4_0, greedy decoding at a fixed seed, perplexity over 12 chunks of wikitext-2. Naive against Auto is the pair that matters - the only comparison where the reduction width actually changes, and also the baseline the decode gain is measured from. Same 96 tokens byte for byte, same twelve per-chunk values, final PPL 19.2128 on all four arms.
Three controls, because a broken test also prints "identical"
| Control | Must | Observed |
|---|---|---|
| Reference arm, run twice | match | identical |
| Reference arm, one word added to the prompt | differ | differs |
| Reference arm over 3 chunks, not 12 | differ | differs |
The third control is what makes the perplexity column mean anything, and it was found
rather than designed. A 3-chunk run scores chunk 1 at 8.3443 where the
12-chunk run scores 8.3423 - same 512 tokens, same file, same 4 threads
on the same cluster. Perplexity packs chunks into one batch, so the chunk total sets
how many sequences are scored together and therefore the shape of the matmuls doing
it. Three sequences in a batch accumulate differently from four.
So the instrument does move when the arithmetic is reorganised, by about two parts in ten thousand. Doubling the thread count and moving the work from the A78 cluster to the A55 cluster moved it by zero.
Runner quant-lab/equivalence.sh, raw outputs
quant-lab/results/equivalence/, full write-up
quant-lab/RESULTS.md.
Why the CPU
The GPU is right there, and it loses by 30×
Everything on this site optimizes the CPU. That was a design decision, and until it is measured it stays a design decision - "we chose the CPU" and "the CPU is the right choice here" are different claims and only the second is evidence. The phone has a Mali GPU advertising Vulkan compute, so the alternative is real rather than hypothetical.
| Backend | Prompt tok/s | Decode tok/s |
|---|---|---|
| CPU, 4 threads pinned | 142.42 ± 0.80 | 14.91 ± 1.19 |
| Vulkan, all layers on GPU | 4.70 ± 0.03 | 7.97 ± 0.09 |
30.3× slower on prompt, 1.9× slower on decode. Same binary,
same Llama-3.2-1B-Instruct-Q4_0, same PP 512 / TG 128, three repetitions,
cooldown before each arm. Not a close call that thermal noise could flip.
And the GPU says why itself, in the line it prints at startup:
Mali-G615 MC2 | uma: 1 | fp16: 1 | bf16: 0
            | int dot: 0 | matrix cores: none
No integer dot product and no matrix cores. Q4_0 inference is integer matmul, and that is exactly the instruction class the ISA ladder shows is worth 4.79× on this CPU. The same workload has a hardware path on the CPU and none on the GPU, so it falls back to generic shader arithmetic. The asymmetry is the mechanism: prompt is compute-bound and collapses 30×, decode is bandwidth-bound and both processors wait on the same memory.
There is no NPU arm, and that is structural
llama.cpp has no NNAPI backend. ggml/src ships CPU, Vulkan, OpenCL, CUDA,
Metal and others, and nothing for Android's neural network API - so for this stack the
NPU question has an answer before any measurement: the path does not exist to be tested.
Saying that is more useful than quietly leaving the arm out.
Multi-turn
The one optimization here that changes the shape, not the constant
Every other number on this site is a constant factor - the same work, done faster. This one is different. Answering turn k of a conversation normally means re-decoding everything said so far, so time-to-first-token grows with the history: O(history). ENTITY saves the conversation's KV cache to a file and restores it instead, which is O(1) in compute and a file read in its place.
A single measurement cannot show a shape, so this sweeps history length. The instrument is
llama.cpp's own --prompt-cache, which uses the same
llama_state_* family the app wraps, so the result does not depend on ENTITY's
UI. Each prompt is a strict prefix extension of the last, the way a conversation grows.
| History | Re-prime | Restore | State file |
|---|---|---|---|
| 171 tok | 1,696.6 ms | 0.00 ms | 5.6 MB |
| 348 tok | 3,368.3 ms | 0.00 ms | 11.4 MB |
| 704 tok | 5,608.7 ms | 0.00 ms | 23.1 MB |
| 1,406 tok | 12,915.9 ms | 0.00 ms | 46.1 MB |
8.2× the history costs 7.6× the prefill - and 0.00 ms either way to restore it. One column has slope, the other is flat, which is the whole claim. The re-prime cost holds at roughly 9.2 ms per token across the range.
What it costs, because it is not free
The state file grows linearly too - 32.8 KB per token, near-identical at every length (32,978 / 32,879 / 32,831 / 32,808 bytes). Trading disk for time is the actual bargain, and 46 MB for a 1,400-token conversation is the price.
End to end in this harness the restore path only wins past roughly 500 tokens of history: below that, a fresh process pays a model load either way and that fixed cost dominates the saved prefill. At 1,406 tokens it is 3.07× faster end to end; at 171 tokens it is slower.
One device, seven backends
What the ISA dispatch is actually worth
ENTITY ships one APK carrying seven CPU backends and picks one at startup by scoring each against the chip. The usual way to argue that is worth something is a cross-device chart - an Armv8.0 phone beside an ARMv9 phone - but that comparison is confounded by everything else that differs between two phones: bandwidth, cluster width, thermal budget, scheduler.
So instead: every variant, forced in turn, on one device. Same model, same
four threads, same pinned cores, same cooldown before each arm. The only thing that changes
is which instruction set the kernels may use. llama.cpp scores backends in whatever
directory it scans, so each variant is isolated in its own folder holding exactly one
libggml-cpu-*.so, and the backend that actually loaded is read back out of
llama.cpp's own log rather than assumed.
| Backend variant | adds | Prompt | Decode |
|---|---|---|---|
armv8.0_1 | NEON only | 31.63 ± 0.03 | 18.29 ± 0.04 |
armv8.2_1 | + dotprod | 151.62 ± 0.19 | 18.50 ± 0.16 |
armv8.2_2 | + fp16 vector | 151.76 ± 0.01 | 18.64 ± 0.09 |
armv8.6_1 | + i8mm | not loaded - this CPU has no i8mm | |
armv9.0_1 … armv9.2_2 | + SVE2, SME | not loaded - Cortex-A78, no SVE2 or SME | |
CMF Phone 1, Dimensity 7300, Llama-3.2-1B-Instruct-Q4_0, PP 512 / TG 128,
4 threads pinned to the A78 cluster, 3 repetitions, 45 s cooldown before every arm.
dotprod is worth 4.79× on prompt and nothing at all on decode
+379.4% prompt, +1.1% decode. Adding one instruction family quintuples one phase and leaves the other inside its own noise - and that is the whole argument, because it is only available on one device with everything else held still. A cross-device chart cannot separate "this chip has dotprod" from "this chip is newer".
The asymmetry is the mechanism made visible: prompt processing is a compute-bound GEMM running the integer matmul kernels dotprod changes, and decode is bandwidth-bound and waiting on memory either way. It is the same split the predictor is built on, and the same one the contributed dataset shows across 13 SoCs at 9.1× against 2.7×.
fp16 vector arithmetic on top adds +0.1% - nothing. Worth publishing precisely because it is nothing: the ladder is not a smooth ramp, it is one step.
The iOS control
How much of this is Arm the architecture, and how much is Arm the platform?
Every optimization here works by reading and steering the hardware - which cores are fast, what they are clocked at, where a thread lands, what the battery is drawing. So: is that about arm64, or about Android exposing arm64?
There is a control, and it is the best one available. Apple silicon is also arm64 - same architecture, same big.LITTLE shape, same class of quantized model, very fast. It simply will not let an application see or steer any of it.
| Mechanism | On Apple silicon |
|---|---|
| Live per-core frequency | no /sys, no public API - gone |
| ADPF deadline hints | no equivalent - gone |
| Energy telemetry | no battery current API - gone |
| Multi-variant v8.0-v9.2 dispatch | cannot load code outside the bundle - gone |
| Core placement | sched_setaffinity absent on Darwin; becomes a QoS request that cannot be read back - degraded |
| Thermal detail | a temperature becomes four coarse levels - degraded |
| Thread count | P-core count reported directly, no heuristic needed - better |
| KleidiAI advisor | pure logic - ports |
| Adaptive context | a better input exists; the port does not yet use it - ports |
| Model-fit catalog | ports, but iOS memory limits are hard and per-app - ports |
Four cease to exist outright; two survive only degraded. A QoS request is not nothing - it is just not verifiable, where Android reads the applied CPU mask back. And one mechanism gets better: Apple reports the P-core count exactly, where Android has to parse per-core max frequency and count what lands within 10% of the fastest - a heuristic this project has already had to correct once. The asymmetry is about steering and observing, not capability.
Then measured it - real int8 ONNX inference, two iPhones
| Device | 1 thread | 2 threads | KleidiAI |
|---|---|---|---|
| iPhone 16 (A18) | 168.8 ms | 197.1 ms (+16.8%) | 1.089× |
| iPhone 17 Pro Max (A19 Pro) | 179.3 ms | 199.7 ms (+11.4%) | 1.045× |
The runtime settles on one thread and reports
affinity: unavailable. On Android the thread count is the single largest
earner in this project. Here a second thread is a straight loss, on both devices -
because there is no way to say which core it may use. The optimization does
not fail because the hardware differs. It fails because the platform will not let you
name a core.
Both phones report SME and SME2, extensions none of the nine Android SoCs here have. It changes nothing: one static binary, no variant to select.
And the cheaper phone wins, then loses. The base iPhone 16 leads at peak - 76.7 against 74.0 tok/s - then gives up 11% over six sustained windows while the Pro Max holds flat at 1.002×. Peak and sustained are different products; only one is on the spec sheet.
Full analysis docs/PORTABILITY-ARM-VS-APPLE-SILICON.md, raw exports
benchmarks/results/ios/, iOS sources and builds ios/.
Against the competition - both sessions, because they disagree
Same phone (CMF Phone 1), same Llama-3.2-1B-Instruct-Q4_0, same PP 512 / TG
128, each app's own benchmark screen. Current session 2026-07-20: all three apps
re-measured the same day, five runs each, 30-minute cooldown between apps.
| App | Prompt | Decode | Threads |
|---|---|---|---|
| PocketPal AI | 88.32 | 13.9 | 6 |
| Arm AI Chat (Arm's own app) | 121 ± 2.99 | 12.4 ± 0.08 | not reported |
| ENTITY | 128 | 18.2 | 4, pinned |
Against Arm's own reference app, on Arm's own silicon: +6% prompt, +47% decode. Against PocketPal: +45% and +31%. Decode is where the thread-count policy acts; the prompt column is close because all three apps run Q4_0 and reach the same KleidiAI kernels.
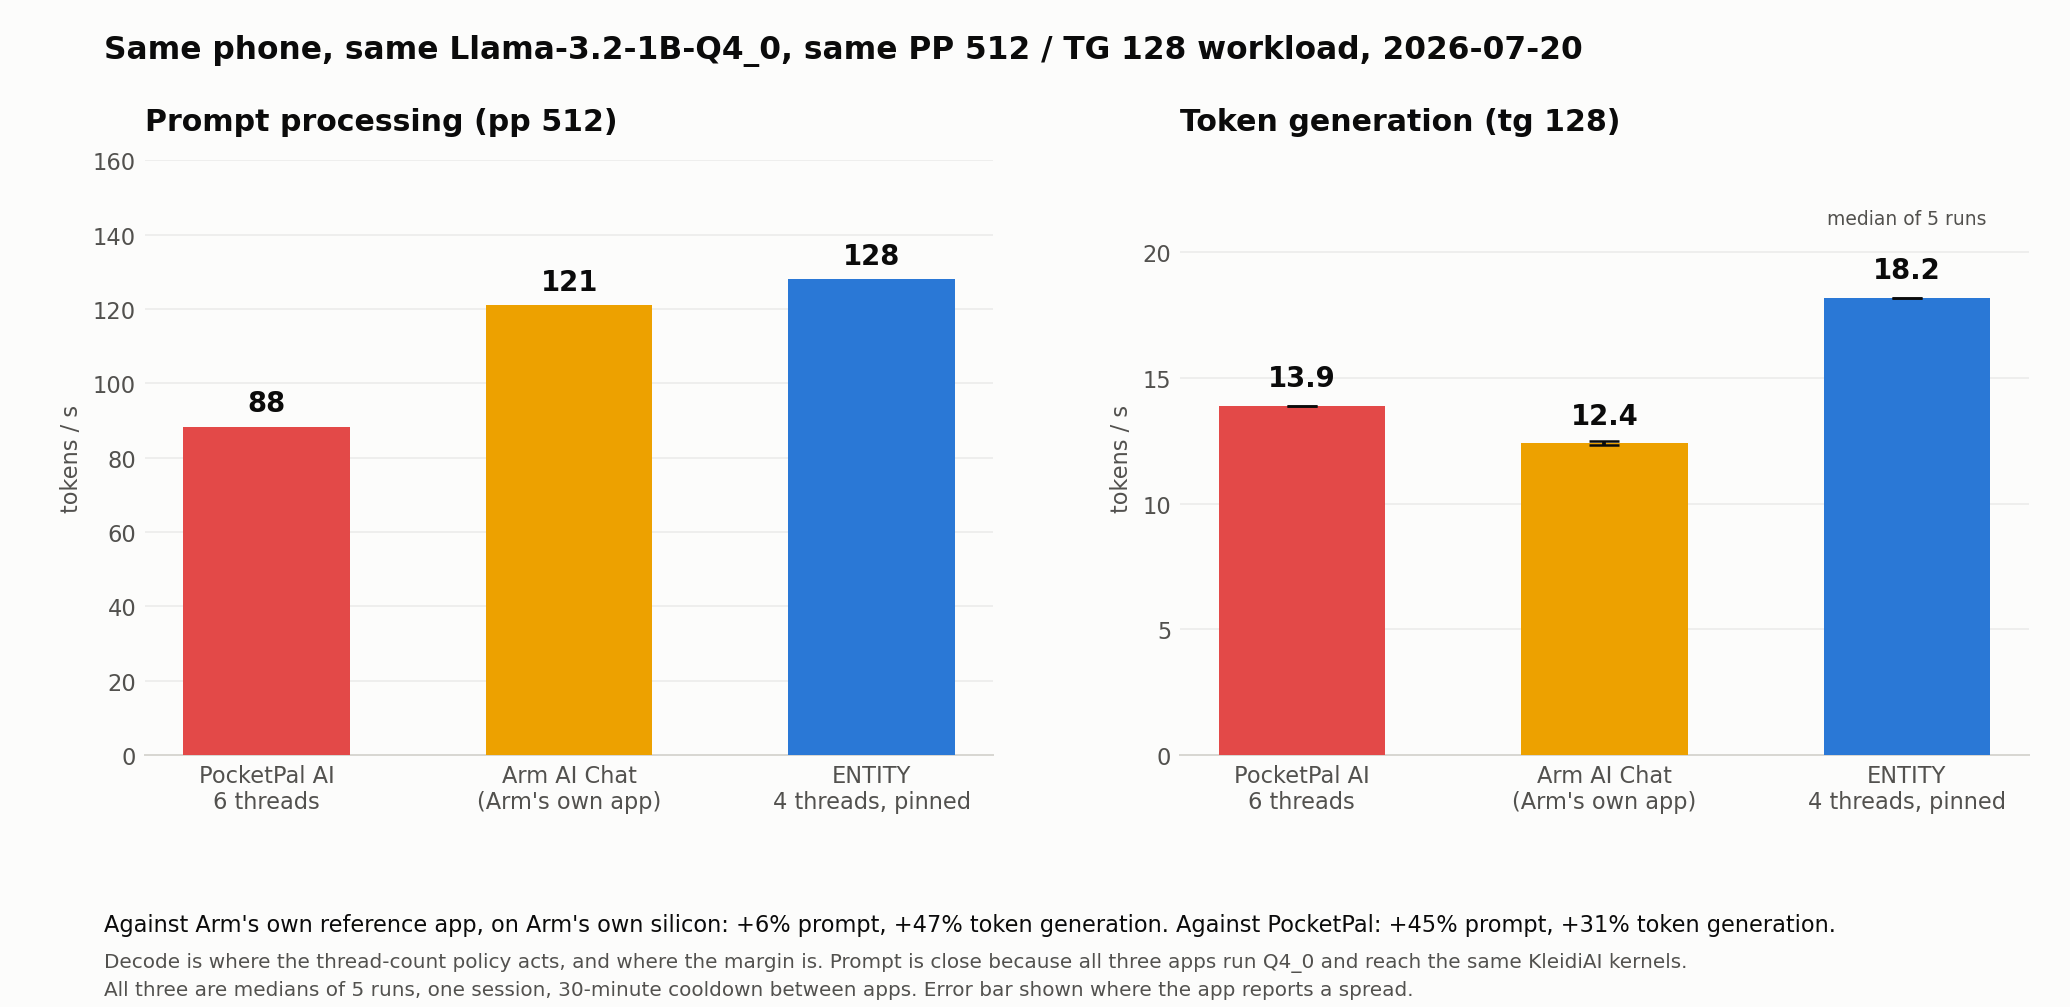
python3 benchmarks/plot_competitors.py Limits
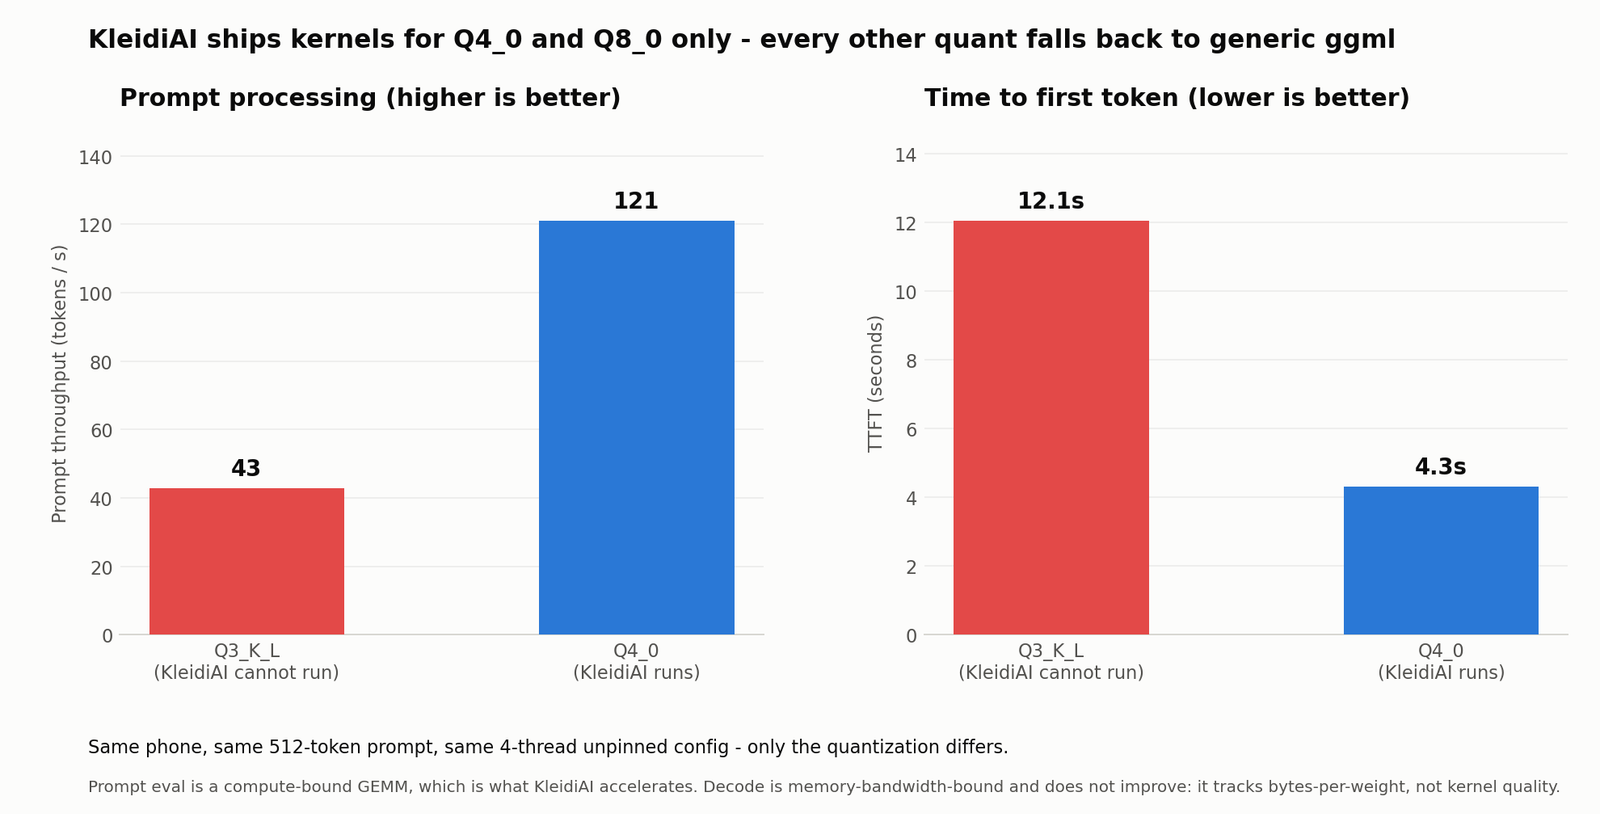
python3 benchmarks/plot_results.py 
Full record: benchmarks/BENCHMARKS.md · protocol:
benchmarks/REPRODUCIBILITY.md · comparison method and both sessions:
benchmarks/competitor-comparison/ · crowd data:
the leaderboard.